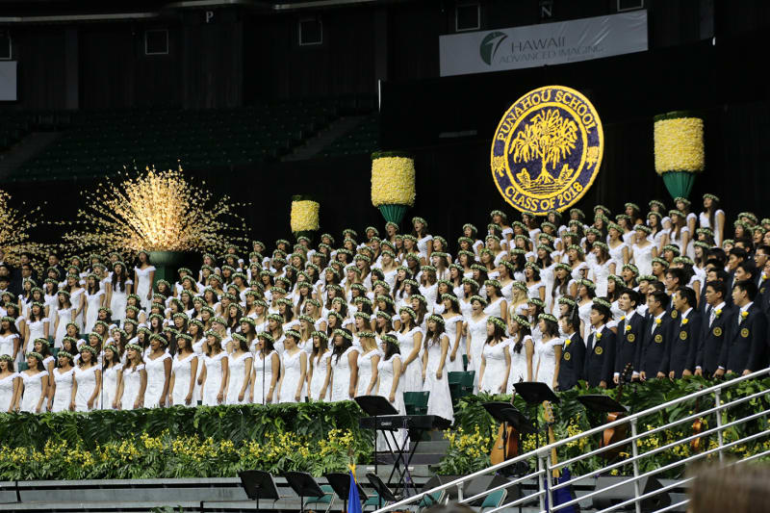
Each winter, we publish the college choices of our last graduating class in the printed Bulletin. The list reflects self-reported colleges and universities attended and other plans of the Class of 2018.

| CLASS SIZE: 439 |
|---|
| Number applied to colleges: 438 |
| Number of college applications filed: 4,074 |
| Average number of applications per student: 9.3 |
| Number of colleges receiving applications: 360 |
| NUMBER OF STUDENTS WHO: |
|---|
| Will attend college: 435 (99%) |
| Four-year college: 430 (99%) |
| Two-year college: 5 (1%) |
| Undecided: 2 (0.5%) |
| Work, Military, Gap Yr, Other: 2 (0.5%) |
| THE CLASS OF 2018 PLANNED TO ATTEND 152 DIFFERENT COLLEGES AND UNIVERSITIES |
|---|
| Public institutions: 33% |
| Independent institutions: 66% |
| % offered need-based financial aid: 58% |
| GEOGRAPHIC DISTRIBUTION OF FINAL COLLEGE CHOICES |
|---|
| Hawai‘i 32 (7%) |
| California 146 (33%) |
| East 93 (21%) PA, NY, NJ, CT, NH, MA,RI, ME, DE, MD, DC |
| Northwest 59 (14%) WA, OR |
| Great Lakes 25 (6%) MN, WI, IL, IN, MI, OH |
| South 22 (5%) TX, LA, AL, MO, FL, MS, GA, NC, SC, VA, MV |
| Central Plains 16 (4%) IO, MT, WY, OK, KS, NE, SD, ND |
| International 16 (4%) |
| Southwest 13 (3%) AZ, NV, NM |
| Rocky Mountain 13 (3%) CO, ID, UT |

